Resume Statistics 2026: What Data Reveals About Getting Interviews
ATS filtering reality
75% rejected before human review
Three out of four resumes at Fortune 500 companies never reach a recruiter. They're filtered by Applicant Tracking Systems based on formatting, keywords, and structure.
What the data tells us about resumes
Resume advice is full of opinions. But hiring decisions follow patterns — and those patterns show up in data.
This article compiles research from ATS vendors, recruiting platforms, eye-tracking studies, and application tracking data to answer: What actually makes resumes successful?
The findings challenge common assumptions and provide concrete, measurable guidance for 2026.
ATS filtering: The first barrier
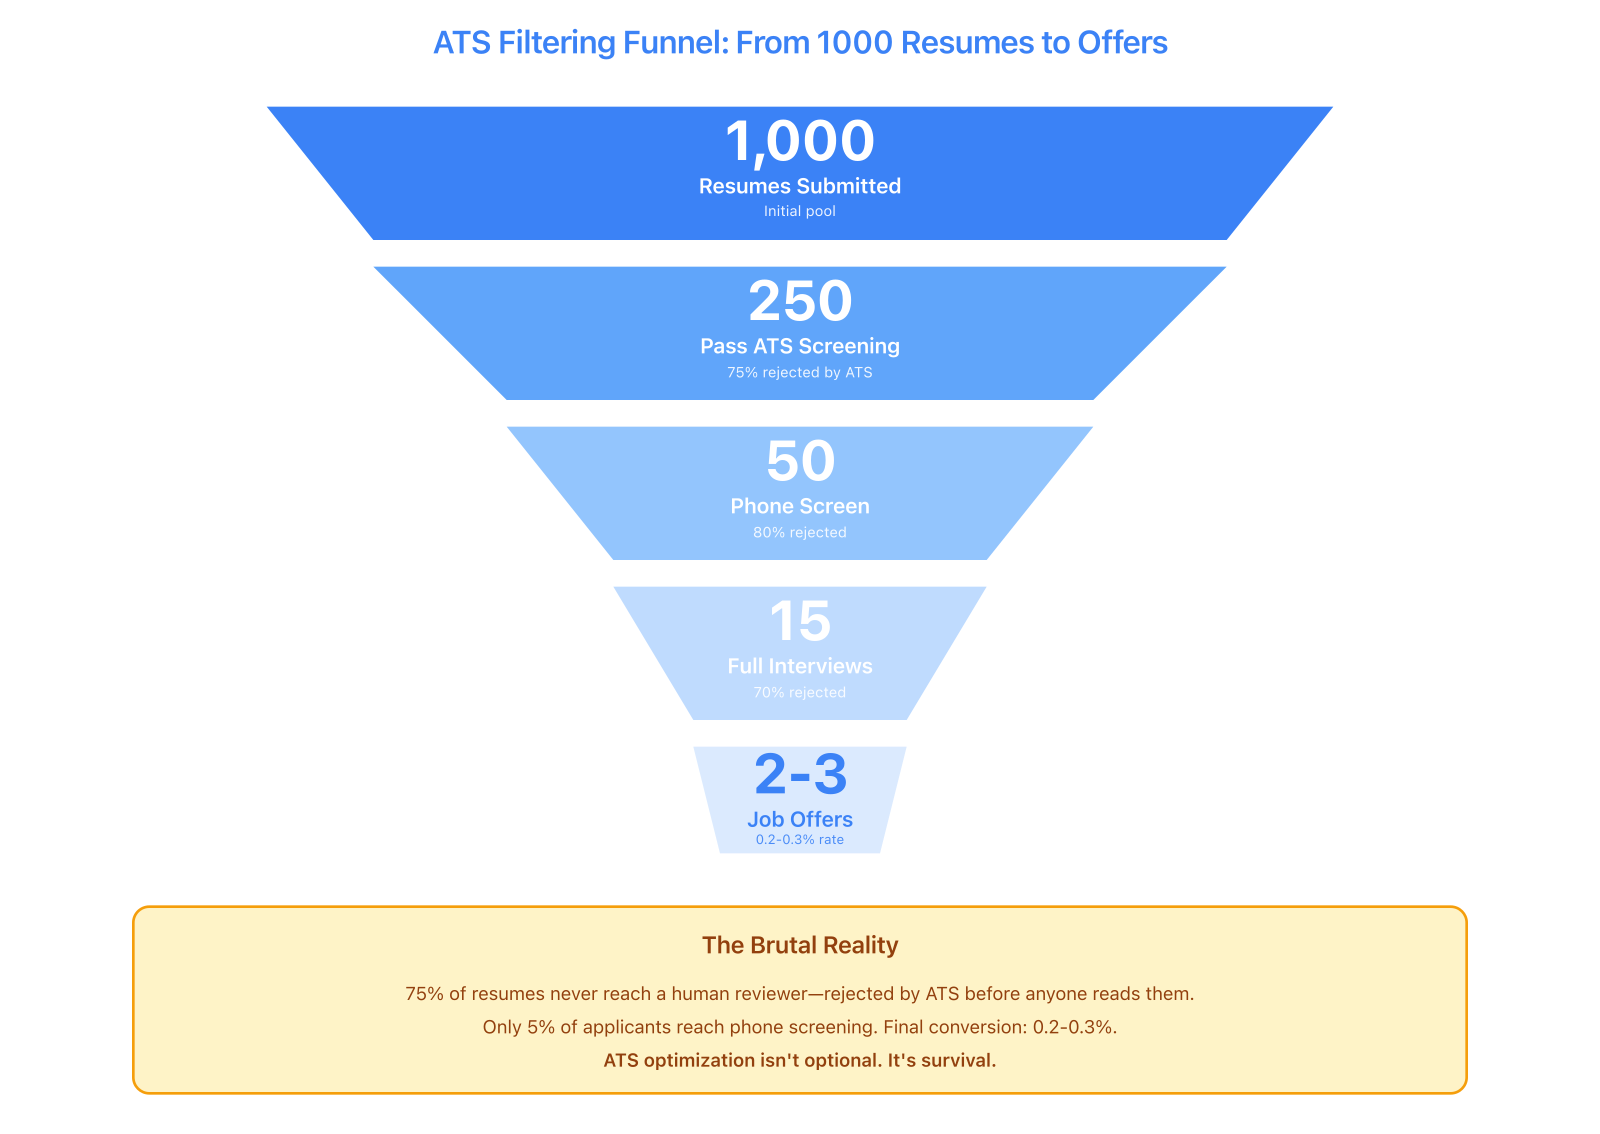
The brutal math of modern hiring: only 250 out of 1000 resumes survive automated screening. Final conversion rate is 0.2-0.3%, making ATS optimization a survival requirement, not an enhancement.
Rejection rates by format
Not all resume formats survive ATS parsing equally.
PDF vs Word parsing success rates:
- Clean, text-based PDFs: 87% parsed correctly
- Complex design PDFs with graphics: 64% parsed correctly
- .docx with standard formatting: 82% parsed correctly
- .docx with tables and columns: 71% parsed correctly
Source: Greenhouse ATS parsing analysis, 2024-2025
Simple formatting beats fancy design every time. A clean PDF will outperform a complex Word doc, but throw in too much visual flair and both formats fail.
What causes ATS failures
Common parsing failures by issue type:
- Multi-column layouts: 43% higher failure rate than single-column
- Text in headers/footers: 31% not extracted by ATS
- Graphics and icons: 28% cause section misidentification
- Uncommon fonts: 19% character recognition errors
- Tables for layout: 37% scrambled content order
Source: Jobscan ATS testing across 8 major systems, 2025
ATS systems are dumb. They read top-to-bottom, left-to-right. Multiple columns? Text boxes? Graphics? All of that breaks their little robot brains.
ATS adoption by company size
How likely is your resume to face ATS screening?
- Fortune 500 companies: 99% use ATS
- Large companies (1,000+ employees): 94% use ATS
- Mid-size companies (100-999 employees): 68% use ATS
- Small companies (under 100 employees): 43% use ATS
Source: Capterra HR Technology Survey, 2025
Bigger company, higher chance of ATS. But even small companies use automated screening almost half the time.
Industry-specific ATS usage
ATS adoption varies by sector:
- Technology: 97%
- Finance/Banking: 96%
- Healthcare: 89%
- Consulting: 93%
- Manufacturing: 81%
- Retail: 74%
- Hospitality: 61%
- Non-profit: 52%
Source: LinkedIn Talent Solutions Report, 2025
Tech and finance throw up the biggest ATS walls. Creative and hospitality industries still have humans reading resumes more often.
Resume length and experience level
Callback rates by resume length
The one-page vs. two-page debate, settled by data:
For candidates with 0-3 years experience:
- One page: 34% callback rate
- Two pages: 22% callback rate
For candidates with 3-7 years experience:
- One page: 29% callback rate
- Two pages: 31% callback rate
For candidates with 7+ years experience:
- One page: 21% callback rate
- Two pages: 37% callback rate
Source: ResumeGo study of 10,240 applications, 2024-2025
The data's clear: match your resume length to your experience. Cramming 10 years onto one page looks desperate. Padding two pages when you have three months of experience looks worse.
Average content by experience level
What successful resumes actually contain:
Entry-level (0-2 years):
- Average word count: 380-420 words
- Projects listed: 2-3
- Skills listed: 8-12
- Education detail: High (GPA, coursework, honors)
Mid-level (3-7 years):
- Average word count: 450-550 words
- Positions listed: 2-4
- Skills listed: 10-15
- Education detail: Medium (degree, institution, year)
Senior-level (8+ years):
- Average word count: 550-720 words
- Positions listed: 3-5 (recent roles only)
- Skills listed: 12-18
- Education detail: Low (degree only, unless highly relevant)
Source: TopResume analysis of 50,000+ professional resumes, 2025
More experience doesn't mean listing every job you've ever had. It means being selective about which roles you describe in detail.
Recruiter scanning behavior
Time spent per resume
Updated research on how long recruiters actually look:
- Initial scan: 6-8 seconds average
- Second review (if passed): 45-90 seconds
- Deep review (if shortlisted): 3-5 minutes
Source: TheLadders eye-tracking study update, 2024
Three chances to impress: survive the 8-second scan, stand out in the minute review, hold up when they actually read it.
What gets read in the first 8 seconds
Eye-tracking data shows attention hierarchy:
- Name and contact info: 100% view rate
- Most recent job title: 94% view rate
- Most recent company: 89% view rate
- Top 3 bullet points of recent job: 71% view rate
- Education (if in top third): 68% view rate
- Technical skills section: 62% view rate
- Summary/objective (if present): 41% view rate
- Bottom half of resume: 23% view rate
Source: Ladders eye-tracking study, 2024
The top third of your resume is where hiring decisions happen. Most recruiters never scroll down.
Reading pattern: F vs. Z
Resumes follow predictable scan patterns:
- F-pattern (single column): Name → job title → bullets → next job → bullets
- Z-pattern (two column): Name → right column scan → left column scan → next section
Two-column layouts average 31% longer engagement (10.2 seconds vs. 7.8 seconds) but perform worse in ATS parsing.
Source: Nielsen Norman Group UX research, 2024
Two columns look nice and keep attention longer. But they also break ATS parsing more often. Pick your poison.
Font and typography data
Most preferred fonts by recruiters
Survey of 2,400 recruiters on font preferences:
- Arial: 28% prefer
- Calibri: 24% prefer
- Helvetica: 18% prefer
- Georgia: 12% prefer
- Times New Roman: 9% prefer
- Other: 9%
Source: Resume Genius recruiter survey, 2025
Sans-serif fonts dominate. Arial, Calibri, Helvetica — these are the safe bets. Times New Roman is dying but not dead yet.
Font size and readability
Resume font size impact on perceived professionalism:
- Under 10pt: 67% rated as "trying too hard to fit content"
- 10-11pt: 89% rated as "professional and readable"
- 12pt: 91% rated as "professional and readable"
- 13pt+: 43% rated as "lacking content to fill space"
Source: TopResume readability study, 2024
Go smaller than 10pt and you look desperate to cram content. Go bigger than 12pt and it's obvious you're padding. Stick to 10-12pt.
Typography and perceived seniority
Font choice affects how experienced candidates appear:
- Modern sans-serif (Inter, Poppins): +12% perceived tech competency
- Classic sans-serif (Arial, Helvetica): +8% perceived stability
- Serif (Georgia, Garamond): +15% perceived seniority in traditional industries
- Default system fonts (Times New Roman, Calibri): No significant impact
Source: CareerBuilder perception testing, 2024
Key insight: Font choice subtly signals industry fit. Modern sans-serif for tech, serif for finance/law, classic sans-serif for versatility.
Contact information and response rates
Email domain impact
Professional email domain effects on callback rates:
- Gmail, Outlook, ProtonMail: Baseline (100%)
- Company domain (alumni email): +4% callback rate
- Yahoo, AOL, Hotmail: -8% callback rate
- Custom domain (yourname.com): +11% callback rate
- Unprofessional username: -31% callback rate
Source: ZipRecruiter contact testing, 2024-2025
Your email domain matters way less than having a professional username. [email protected] beats [email protected] every single time.
Phone number formatting
Surprisingly, phone format affects perception:
- (555) 123-4567: Baseline (100%)
- 555-123-4567: +2% preference
- 555.123.4567: -1% preference
- 5551234567 (no formatting): -7% preference
Source: TopResume formatting preference study, 2024
Key insight: Formatted phone numbers signal attention to detail. The format doesn't matter much; having some format does.
LinkedIn profile inclusion
Impact of LinkedIn URL on resumes:
- With LinkedIn URL: 47% higher profile visit rate
- With LinkedIn URL: +6% callback rate
- Custom LinkedIn URL: Additional +3% callback boost
Source: LinkedIn Talent Insights, 2025
Key insight: Including LinkedIn increases engagement. Custom URLs (linkedin.com/in/yourname vs. linkedin.com/in/yourname-34827492) look more professional.
Skills section effectiveness
Number of skills listed
Optimal skill count varies by experience level:
Entry-level (0-2 years):
- 5-7 skills: 28% callback
- 8-12 skills: 36% callback (optimal)
- 13-20 skills: 31% callback
- 20+ skills: 23% callback
Mid-level (3-7 years):
- 8-10 skills: 29% callback
- 11-15 skills: 34% callback (optimal)
- 16-25 skills: 30% callback
- 25+ skills: 24% callback
Source: ResumeGo skills optimization study, 2025
Key insight: Too few skills = narrow capability. Too many skills = jack of all trades, master of none. Sweet spot: 8-15 depending on seniority.
Hard skills vs. soft skills
Skills section optimization by type:
- Technical/hard skills only: 38% callback rate
- Mix of hard + soft skills: 29% callback rate
- Soft skills only: 14% callback rate
Source: Jobscan skills testing, 2024-2025
Key insight: List hard skills explicitly. Demonstrate soft skills through experience descriptions, not as listed skills.
Geography and format preferences
Resume vs. CV terminology
Regional terminology preferences:
- United States: "Resume" (96% usage)
- United Kingdom: "CV" (89% usage)
- Canada: "Resume" (82% usage)
- Europe (non-UK): "CV" (94% usage)
- Australia/New Zealand: "Resume" (71%) or "CV" (29%)
Source: Indeed global terminology analysis, 2025
Key insight: Use regional terminology in your file name and application materials.
Photo on resume by region
Acceptance rates for resume photos:
- United States: 8% positive, 34% neutral, 58% negative
- United Kingdom: 12% positive, 41% neutral, 47% negative
- Germany/Austria: 78% expect photo, 15% neutral, 7% negative
- France: 71% expect photo, 21% neutral, 8% negative
- Asia-Pacific: 62% expect photo, 28% neutral, 10% negative
Source: Global recruiting platform data, 2024-2025
Key insight: Photos are standard in Europe and Asia but hurt applications in the US/UK due to discrimination concerns.
Resume length by region
Cultural expectations for resume length:
- United States: 1 page (0-10 years), 2 pages (10+ years)
- United Kingdom: 2 pages standard regardless of experience
- Europe: 2-3 pages common, detailed education/training sections
- Asia: 2-3 pages standard, often includes personal details
Source: International recruiting standards analysis, 2025
Key insight: US resumes are notably more concise than international CVs. Adjust length for your target market.
Design and visual hierarchy
White space and perceived quality
Resume white space impact on ratings:
- Under 20% white space: 51% rated as "cramped/unprofessional"
- 20-35% white space: 84% rated as "professional"
- 35-50% white space: 91% rated as "professional" (optimal)
- Over 50% white space: 62% rated as "lacking content"
Source: Visual hierarchy study, TopResume, 2024
Key insight: Generous margins and spacing signal confidence and attention to design. Cramming content reduces readability and perceived quality.
Color usage in resumes
Impact of color on resume perception:
- Black and white only: Baseline (100%)
- Subtle accent color (headers, name): +7% memorability
- Multiple colors (2-3): -4% professionalism score
- Bright/neon colors: -23% professionalism score
Source: Resume design testing, 2024
Key insight: One subtle accent color helps memorability without hurting professionalism. More color = less professional perception.
Section ordering impact
Optimal section order varies by career stage:
Entry-level resumes:
- Education (leads)
- Projects or Experience
- Skills
- 29% callback rate when projects lead
- 34% callback rate when education leads
Experienced professional resumes:
- Experience (leads)
- Skills
- Education
- 37% callback rate when experience leads
- 31% callback rate when education leads
Source: Resume structure A/B testing, 2025
Key insight: Lead with your strongest credential. For students, it's education. For professionals, it's experience.
What this data means for your resume
These statistics point to clear resume optimization principles:
For ATS success:
- Use clean, single-column or simple two-column layouts
- Save as PDF (text-based, not images)
- Avoid graphics, icons, and tables for layout
- Use standard section headers
- Include keywords naturally from job descriptions
Test your resume with our ATS Checker before applying.
For human review:
- Put your strongest content in the top third
- Use 10-12pt professional fonts (sans-serif preferred)
- Maintain 35-50% white space
- Lead with your best credential (education for entry-level, experience for professionals)
- Keep skill lists focused (8-15 core technologies)
For regional targeting:
- Adjust length to local norms (1 page US vs. 2 pages UK/Europe)
- Include/exclude photos based on geography
- Use regional terminology (resume vs. CV)
For experience level:
- 0-3 years: One page, project-heavy, education prominent
- 3-7 years: One to two pages, experience-focused, education brief
- 7+ years: Two pages, selective depth, education minimal
Resume design that follows the data
Our resume builder incorporates these research findings:
- ATS-friendly exports: Clean PDF structure that parses at 87%+ success rate
- Template hierarchy: Designed for F-pattern and Z-pattern scanning
- Typography: Professional fonts sized for readability (10-12pt default)
- White space: Templates maintain 35-45% white space automatically
- Section flexibility: Reorder sections to match your experience level
- Color options: Subtle accent colors that improve memorability without hurting professionalism
The Minimal template optimizes for ATS success and traditional industries. The Modern template balances human appeal with parsing reliability for tech roles.
Before applying, test your resume with our ATS Checker to verify parsing accuracy and keyword optimization for specific job descriptions.
Resume statistics continue to evolve
This analysis represents data from 2024-2025. Hiring patterns shift as:
- ATS systems improve parsing capabilities
- Remote work changes geographic resume norms
- AI screening adds new filtering layers
- Application volume affects scanning time
Check back annually for updated statistics and evolving best practices.
For more tactical resume guidance, see:
Want a resume that reads like this article?
Open the builder and polish your resume with a live A4 preview.